
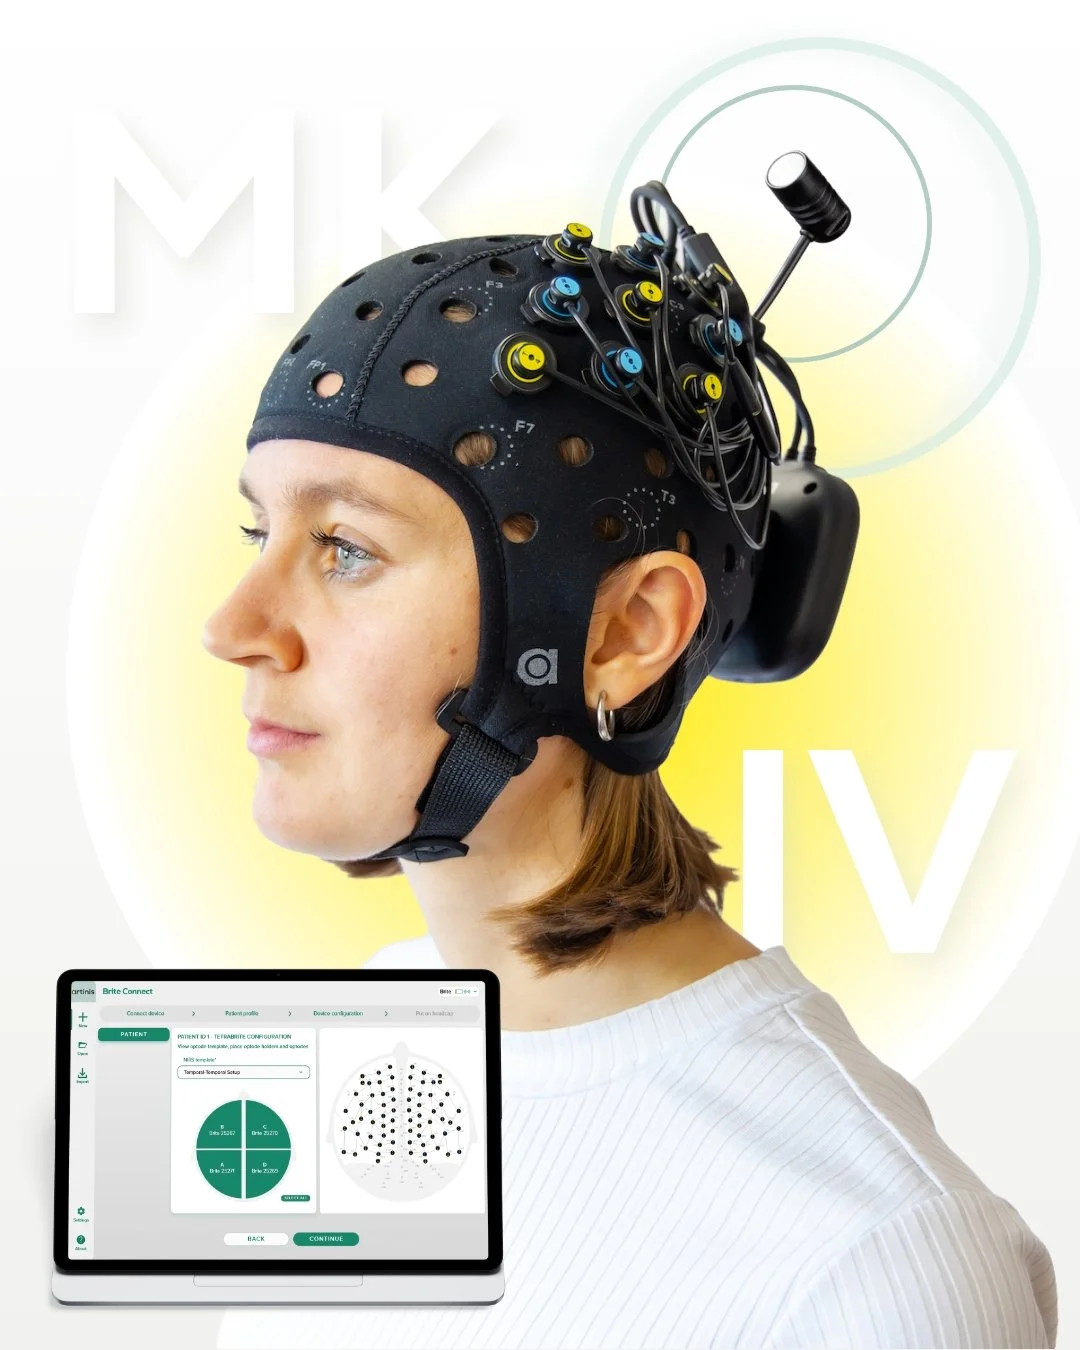
How NIRS is used in brain-computer interfaces
Imagine a person wearing a Brite and playing a demanding video game. This video game is difficult, and the mental workload is increasing drastically. Changes in blood volume, or hemodynamic changes, which are associated with the increase in workload are registered using the Brite. The signals that the Brite is measuring are sent in real time to an analysis system. This system gauges the increase in mental workload and subsequently lowers the difficulty of the video game by 5%. This is an example of a NIRS-based brain-computer interface (BCI), in which physiological signals detected from the brain are translated and used to control an output device (like a computer). This blog will expand on how a NIRS-based BCI works and what researchers have made possible using NIRS-based BCI.
ℹ This feature is outdated and support for BCI is now implemented via LSL. More information about LSL.
How it works
The most basic BCI can be built with a one-channel system, consisting of one detector and one transmitter. This means that on one place in the brain the hemodynamic changes are measured. In practice, a multi-channel system will be used more often, because this provides you with more data and brain areas to measure simultaneously. Additionally, you should think about what brain area you want to use for your BCI: all sorts of brain activation can be used. In this example, we will play the well-known ‘Snake’ game with our motor cortex. A nice piece of Matlab-code by Per-Anders Ekstrom for the game can be downloaded from this website and the interface is shown in Figure 1.
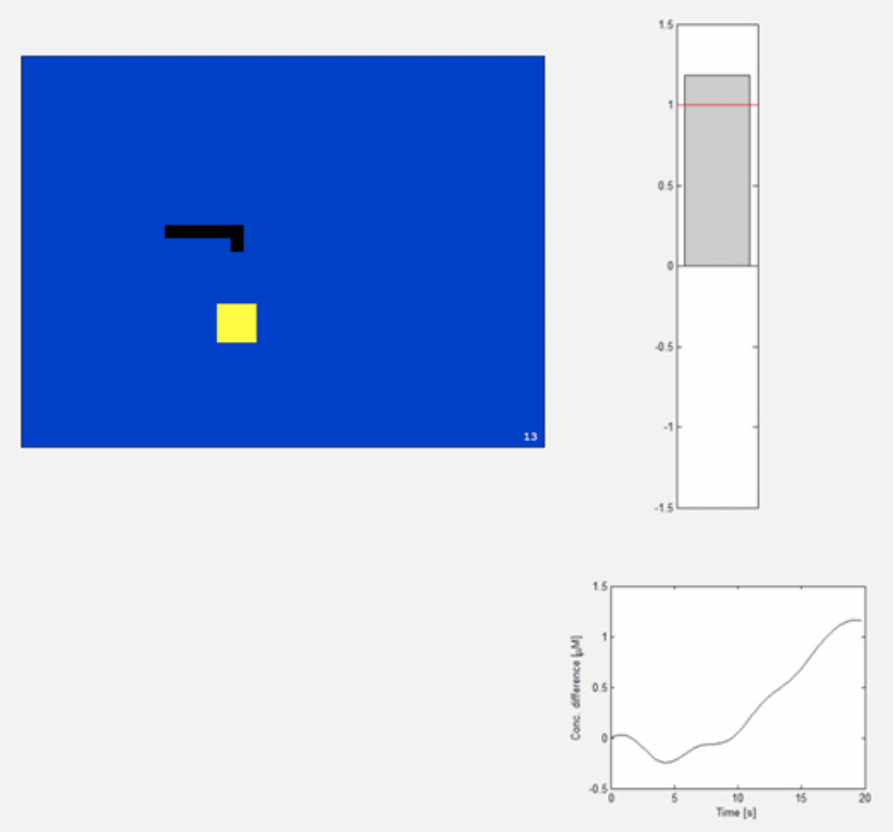
Figure 1. On the left, you can see the Matlab interface of the game ‘Brain Snake’. The snake is controlled via a NIRS-based BCI by hemodynamic signals in the motor cortex induced by finger tapping. The image on the right shows the input of hemodynamic changes displayed by our own Matlab script. If the difference is over 1 μM, the snake will turn right.
Our software OxySoft is used for recording the NIRS data. In OxySoft, the recorded data can be managed and analyzed. However, in order to do real-time analysis and data manipulation, we need to stream our data in real-time to the analysis software of choice that will be used as input for the game. For example, the data measured by the OxyMon can be streamed into the FieldTrip buffer. FieldTrip is a Matlab based toolbox and can be downloaded for free from the FieldTrip website. With FieldTrip, you can analyze NIRS data in real-time; very useful for BCI. You can also stream your data real-time with Lab Streaming Layer (LSL) to any device and software connected to your network. We linked a data stream to Matlab, and implemented a script so the snake can use the data to turn.
The top graph of Figure 2 (channel 1) shows the typical raw hemoglobin changes that are measured in rest. Finger tapping is performed between the vertical blue lines. In the raw data, you can see an oscillation at a fast frequency (the heartbeat), and other oscillations at a lower frequency (slow vasomotion). These low frequency waves have amplitudes comparable to the hemoglobin concentrations changes and thus, they can mask the changes. We can increase the success rate of this BCI significantly by adding a short separation channel to the setup (Figure 3). The graphs of channel 2 in Figure 2 shows the signals measured by the short separation channel. The filtered signal, where the short separation channel is used to filter out the heartbeat and slow vasomotion, is plotted in the bottom graph of Figure 2. In this graph, we can see a very clear response to the finger tapping. After the start of the finger tapping, with a few seconds delay, the oxyhemoglobin concentration increases (typically about 1-2 μM) and the deoxyhemoglobin concentration decreases with a smaller amount (~ 0.5 μM). You can see these changes in the bottom graph of Figure 2. When the signal amplitude increases above a certain threshold value, the snake will make a right turn. As such, the user can control the snake and direct it to the yellow blocks.

Figure 2. Typical oxyhemoglobin (red) and deoxyhemoglobin (blue) concentration changes were measured in the motor cortex (graphs made in OxySoft). The x-axis shows time in seconds and the y-axis shows concentration changes in micromolar. Finger tapping is performed between the vertical blue lines. The top graph shows the hemodynamic changes measured using 4 cm inter-optode distance (channel 1) and the graph below shows the hemoglobin concentrations at the more superficial channel with 1.5 cm inter-optode distance (channel 2). The difference between the two channels is plotted in the bottom graph. A multiplication factor (MF) is used in the subtraction (MF x channel 1- channel 2). In this case, the multiplication factor for O2Hb is 1.6. A cyclic average with standard deviation over the three finger tapping periods is plotted as well.
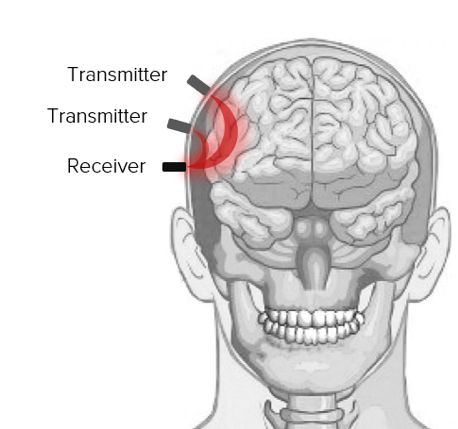
Figure 3. Double channel NIRS setup. A reference channel is created by adding a second transmitter with small inter-optode distance.
What has been done
BCI’s have many applications including health care, marketing, education, entertainment and security. All these applications, and more, are being explored as we speak. Currently, NIRS is being used extensively for the creation and development of BCI’s. Researchers Zephaniah and Kim (2014) wrote a review article on the recent developments and applications of NIRS-based BCI. To our delight, they mention our PortaLite and write the following sentence on it: “This is just an example of a sensor that shows convenience and portability that would make it ideal for a BCI system.” We believe this holds true for the OctaMon and the Brite as well, and we believe much more interesting research can be done with our devices. In the meantime, everyone is learning more about BCI’s every day, partly due to the great work of our customers. A few examples:
Ruotsalo et al. (2024) investigated the potential of real-time fNIRS-BCI in affective annotation by measuring brain activity during crowd affective experience of individuals with the Brite. Performance improved significantly with increased crowd size, and accurate affective annotations could be achieved.
Liang et al. (2023) performed a study using fNIRS-BCI to explore neural responses to cinematic content of one specific genre (horror), but in different audiovisual modes using the OctaMon. Changes in neural activity between different modes could be shown, and results might hold potential for future adaptive horror experiences.
Li et al. (2021) developed a novel experimental paradigm to enhance accuracy when using fNIRS-only BCI for hand motor imagery classification using the Brite. High classification accuracy values demonstrated the effectiveness of this newly proposed method.
Kamavuako et al. (2018) tested the feasibility of fNIRS-BCI to classify overt and covert speech. High classification accuracy could be achieved suggesting the potential of fNIRS-BCI in reliably detecting covert speech.
“Thank you all for your work on BCI, and we are looking forward to more research in this fascinating area!”
References
1. Ruotsalo T, Mäkelä K, Spapé M. (2024). Crowdsourcing Affective Annotations Via fNIRS-BCI. IEEE Transactions on Affective Computing, vol. 15, no. 1, pp. 297-308, Jan.-March 2024, doi: 10.1109/TAFFC.2023.3273916
2. Liang X, Landowska A, Ramchurn R, Berger C, Wilson M, Maior H. (2023). The Power of Fear: Exploring the Neural Responses to Horror Scenes in Different Audiovisual Modes. 77-84. 10.37789/rochi.2023.1.1.12.
3. Li C, Yang H, Cheng L. Fugl-Meyer hand motor imagination recognition for brain–computer interfaces using only fNIRS. Complex Intell. Syst. 8, 731–741 (2022). https://doi.org/10.1007/s40747-020-00266-w
4. Kamavuako EN, Sheikh UA, Gilani SO, Jamil M, Niazi IK. Classification of Overt and Covert Speech for Near-Infrared Spectroscopy-Based Brain Computer Interface. Sensors (Basel). 2018 Sep 7;18(9):2989. doi: 10.3390/s18092989.


At Artinis, our mission is simple: make imaging easy, so researchers can focus on what matters, their research. Large-scale hyperscanning presented a clear challenge. We answered it the same way we always do: by removing the complexity and making it accessible.