
In Artinis NIRS blog, you will find the latest trends in (f)NIRS, NIRS studies and applications, tutor from the leaders of near infrared spectroscopy, not to mention detailed insights and tips and tricks for your research!
Search blog post topic
Ensuring good fNIRS data quality — Automatic assessment of signal quality
In fNIRS, achieving high data quality is crucial for reliable results, but it can still bear challenges due to hair or skin pigmentation, especially when using fNIRS systems with a higher channel number. In this blog, we present automated signal quality assessment methods that can serve as an efficient solution to detect good and poor data quality in fNIRS measurements.

Which experimental designs to use in fNIRS — Resting-state design
Resting-state design using fNIRS can give information on neural networks and functional brain architecture, and is often used in developmental and clinical studies. In this blogpost, we discuss the characteristics, advantages, and considerations of resting-state experiments and give recommendations for successful fNIRS resting-state studies.
Motion artefacts in (f)NIRS — How to address them
Movement is one of the most common causes for artefacts in neuroimaging tool such as fNIRS. Once motion artefacts are detected, it is important to decide on how to address them to preserve data validity. In this third blogpost of our motion artefact series, we present different methods to correct for motion artefacts and their advantages and disadvantages.

Motion artefacts in (f)NIRS — How to best detect them
Although fNIRS is relatively insensitive for motion artefacts, they cannot be completely prevented. Fortunately, there are various ways to detect motion artefacts. In this second part of our blogpost series on motion artefacts, we explain different methods of detections and elaborate on their advantages and disadvantages.
Motion artefacts in (f)NIRS — Not a problem, but not to be overlooked
Due to its portability and ease of use, fNIRS is applied in a variety of research fields, especially in study designs involving movement. Although fNIRS is relatively insensitive to motion artefacts, they still can occur and might influence signal quality. In this first part of our blogpost series on motion artefacts in NIRS, we explain what movement artefacts are and how they can be recognized.

Non-cerebral physiological interference in functional Near-Infrared Spectroscopy (fNIRS), a CURSE or BLESSING?
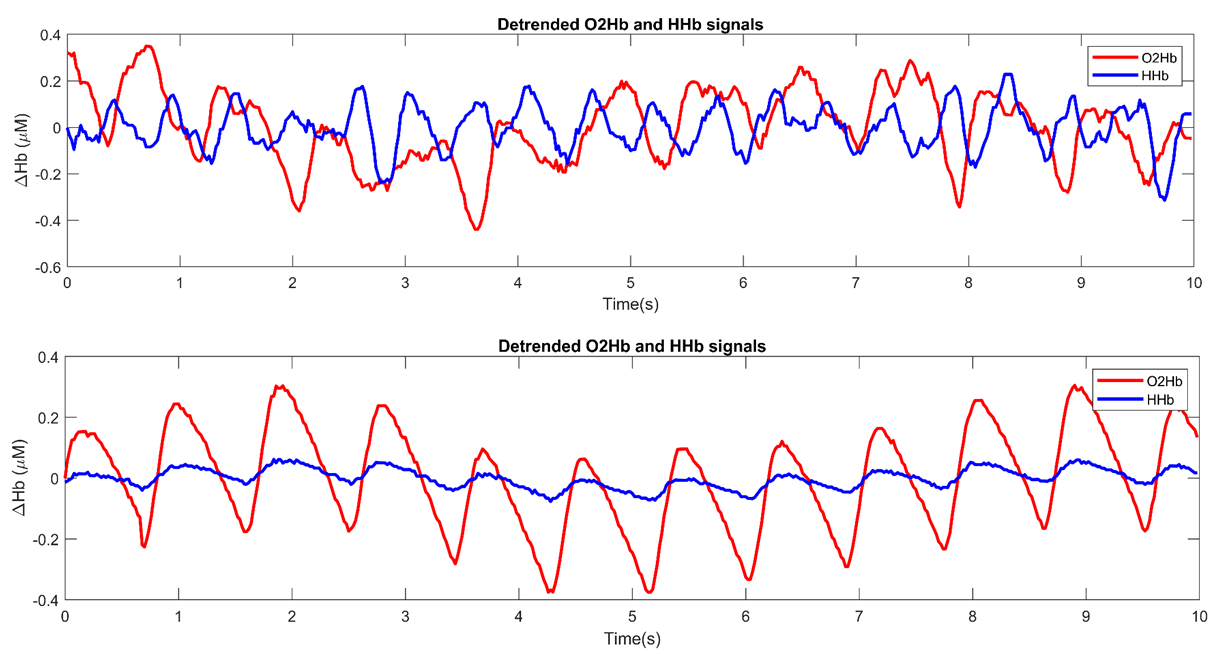
Our fNIRS devices offer a high sampling rate, enabling extraction of additional physiological parameters, including respiratory rate (RR). These parameters can provide important additional information that can be used as adjunction to cerebral activity measures. In this blogpost, the possibility of RR estimation from fNIRS in a resting state is discussed in the form of a case study.
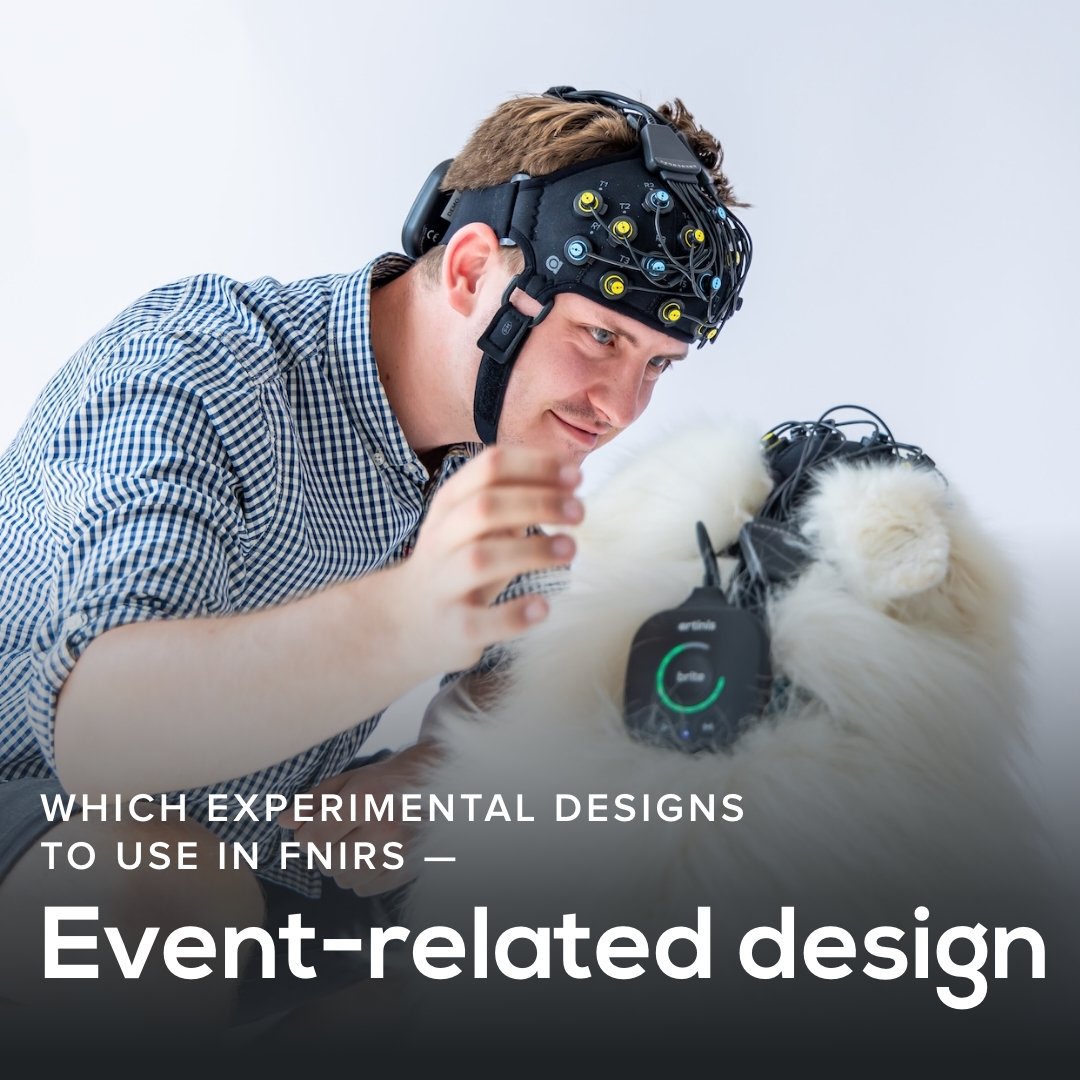
Which experimental designs to use in fNIRS — Event-related design
Event-related study design is frequently used in fNIRS experiments, especially in naturalistic settings or multimodality setups. In this blogpost, we explain what event-related study design is, and dive into its advantages and considerations, as well as recommendations on how to best set up an event-related fNIRS study.
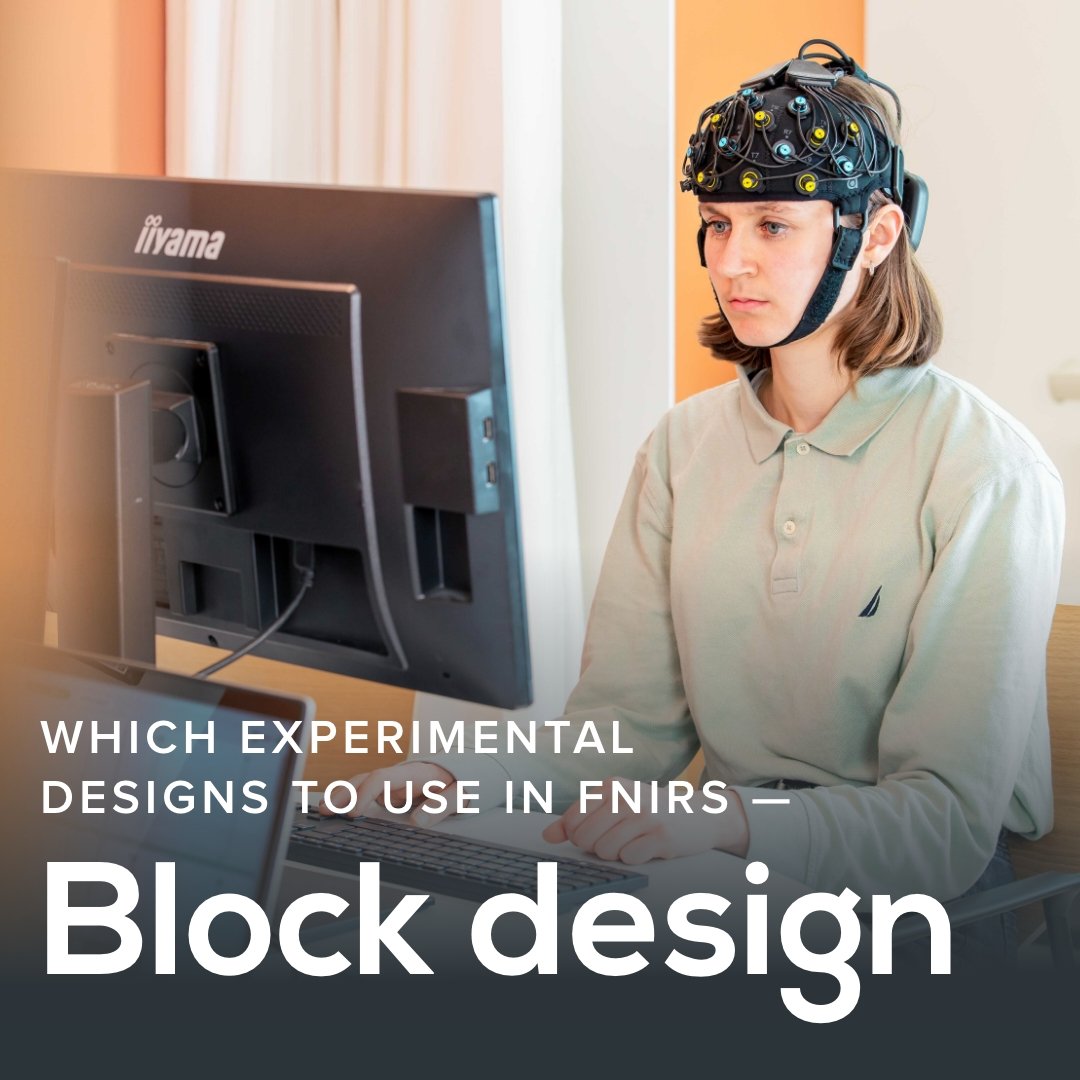
Which experimental designs to use in fNIRS — Block design
Block design is one of the most frequently used experimental designs when performing fNIRS experiments, as it offers various advantages. In this blogpost, we explain characteristics, advantages and considerations of block design experiments, and give recommendations on how to correctly use it in your fNIRS research.
Which experimental designs to use in fNIRS — Introduction
This is the introduction post of our blogpost series on experimental designs in fNIRS. In this blogpost, we explain what fNIRS measures, which general considerations have to be considered, and which frequent experimental setups we have for fNIRS.
Multimodal fNIRS-EEG measurements — Analysis approaches
When it comes to deciding on an appropriate data analysis approach in multimodal fNIRS-EEG measurements, the soundest consideration factors ultimately depend on the research question at hand. Therefore, the analysis steps may vary from one study to another. Nonetheless, they can broadly be classified into two strategies: parallel data analysis and informed data analysis.
Assessing NIRS signal quality – Implementation of the Signal Quality Index (SQI)
Achieving good signal quality is crucial for (f)NIRS data acquisition and analysis, but often difficult to determine. Therefore, we developed an algorithm named SQI (Signal Quality Index) which rates NIRS signal quality. Read this blogpost to learn more on how this SQI is specified and how it can be implemented in your research.

The use of Inertial Measurement Unit (IMU) to detect motion artifacts
Due to its portability, NIRS and fNIRS devices are often used to measure brain and muscle activity during studies that involve movement. To detect motion artifacts that might occur during these experiments, some of our devices, for instance, Brite and PortaLite MKII, incorporate an inertial measurement unit (IMU). Read this blog post, to learn more about the technology behind IMU and how it is used to detect motion artifacts.