
Multimodal fNIRS-EEG measurements — Analysis approaches
In the previous blog post of this series, we described experimental designs that can be adopted in multimodal fNIRS-EEG measurements. As discussed, the more suitable choice will ultimately depend on the research question at hand. The same applies when it comes to deciding on an appropriate data analysis approach, and therefore, analysis steps will differ from study to study. Yet, they can generally be categorized into two strategies: parallel data analysis and informed data analysis.

Figure 1. Simultaneous fNIRS-EEG recording in our software OxySoft.
Parallel data analysis
In this approach, fNIRS data and EEG data are analyzed independently. However, given that each technique captures different, but complementary, aspects of neural activation, it may be of interest to look at how EEG and fNIRS findings correlate with each other.
Additionally, a trending application field for multimodal fNIRS-EEG measurements is Brain-Computer Interface (BCI). A BCI system often consists of machine learning algorithms that use brain activity data as input to perform clustering or classification. Recent studies (e.g., Yi et al., 2023; Xu et al., 2023) have shown that classification accuracy can be improved in multimodal measurements, when compared to only using the input provided by either technique.
Informed data analysis
In this case, the data of one technique is analyzed first and the output is used in the analysis of the other. In this sense, this strategy can be divided in two subcategories:
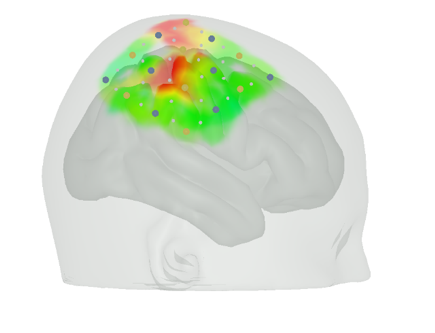
Figure 2. Example of fNIRS activation map in OxySoft for a finger tapping task.
A) fNIRS-informed EEG analysis
EEG channel data lacks high spatial resolution due to volume conduction effects. This means that changes which originate from a single source can be reflected in multiple EEG channels. Therefore, EEG researchers usually try to estimate the locations of EEG generators: this is called source localization. Source localization is an ill-posed inverse problem meaning that there are indefinite sets of sources that could result in the same scalp projection. Therefore, some electrophysiological and neuroanatomical constraints (such as the electrical head model) should be taken into account to provide a more accurate estimation.
fNIRS measures local changes and therefore fNIRS data analysis can provide an activation map. This map represents the brain areas in which the observed changes originate. This additional localization data can be used a priori for the EEG inverse problem described above. fNIRS-informed EEG data analysis can be used to further study the underlying brain networks of atypical EEG patterns in individuals with neurological disorders.
B) EEG-informed fNIRS analysis
One of the most common approaches used to analyse fNIRS data is the General Linear Model (GLM). GLM regresses the measured fNIRS signal as the weighted sum of expected hemodynamic responses to stimuli throughout the experiment. The general formula for a GLM is as follows:
Y = Xβ + ε, where Y is the measured fNIRS data, X is the regressor matrix which results from the convolution of a hemodynamic response function (HRF) with a boxcar or impulse function, β are to be estimated weights, and ε is the random error which should be minimized.
EEG features, such as frequency band powers or peak amplitude of ERP components, might be a better representative of the time varying characteristic of the hemodynamic response compared to a boxcar or impulse function. Therefore, in the case of EEG-informed analysis, features from the EEG data are used to build the regressor matrix.
Studies have shown that EEG-specific regressors can improve the localization of task evoked regions. For example, EEG-informed data analysis can be used for monitoring epileptic activities with higher sensitivity.
Here we briefly explained common data analysis approaches for combined fNIRS-EEG studies. For more detailed information, we invite you to have a look at the suggested literature and at further similar publications.
Suggested literature:Li, Rihui, et al. “Concurrent fNIRS and EEG for brain function investigation: a systematic, methodology-focused review.” Sensors 22.15 (2022): 5865.
Yeung, Michael K., and Vivian W. Chu. “Viewing neurovascular coupling through the lens of combined EEG–fNIRS: A systematic review of current methods.” Psychophysiology 59.6 (2022): e14054.
ReferencesYi, L., Xie, G., Li, Z., Wu, K., Sun, J., & Liang, J. (2023). Automatic depression diagnosis through hybrid EEG and near-infrared spectroscopy features using support vector machine. Frontiers in Neuroscience, 17, 1205931.
Xu, T., Zhou, Z., Yang, Y., Li, Y., Li, J., Bezerianos, A., & Wang, H. (2023). Motor Imagery Decoding Enhancement Based on Hybrid EEG-fNIRS Signals. IEEE Access.
This is the last blog post in our series on multimodal fNIRS-EEG measurements. We hope that our posts have helped you to get started with your fNIRS-EEG studies!
