
Ensuring good fNIRS data quality - Automatic assessment of signal quality
When working with fNIRS data, obtaining high-quality signals is essential for reliable results. Our Support Hub provides practical tips to help you optimize signal acquisition. However, despite best practices, challenges like dark or thick hair, or highly pigmented scalp tissue, can still lead to poor signal quality on some channels.
This is particularly relevant for high-density systems like the Brite or MultiBrite, where the high number of optodes make it difficult to ensure good quality across all channels. Manually assessing signal quality becomes impractical, especially with large datasets. Automated signal quality metrics offer an efficient solution. In this blogpost, we explain what good signal quality in fNIRS means, present different methods for automated fNIRS signal quality assessment and list their pros and cons.
What is a good signal quality in fNIRS?
Besides the task-evoked hemodynamic response, the fNIRS signal also contains physiological rhythms, such as heart rate and respiration. While these are often considered noise during cognitive analysis, they can be leveraged for advanced analysis, like extracting heart or respiratory rates (see our posts on heart rate and respiratory rate).
The presence of a clear cardiac cycle, especially in the oxygenated hemoglobin (O2Hb) signal (see Figure 1), is a strong indicator of good optode-scalp coupling. In other words, if the heartbeat is clearly visible, the signal is of good quality.
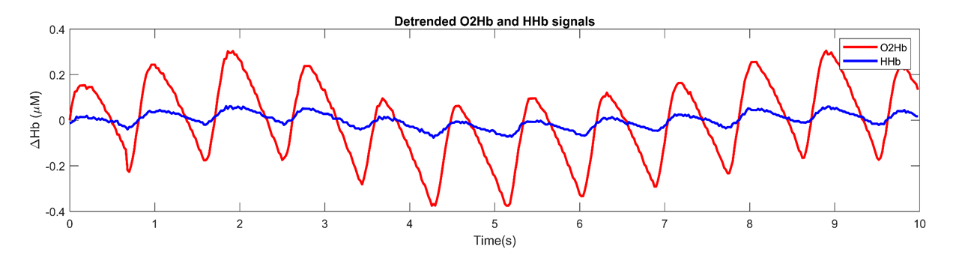
Figure 1: A segment of an fNIRS measurement. Red is displaying oxygenated hemoglobin (O2Hb) and blue is displaying deoxygenated hemoglobin (HHb).
Signal quality algorithms
A variety of algorithms have been developed to automate signal quality assessment. Below, we introduce four commonly used approaches.
Coefficient of variation (CV)
A method is the Coefficient of Variation (CV), a statistical measure of relative variability often applied to raw light intensity signals [1]:
CV = (Standard Deviation / Mean) * 100%
A high CV typically indicates an unstable signal, which may result from motion, poor optode contact, or systemic noise.
PRO: The CV is a straightforward solution for automating assessment of signal quality.
CON: The key limitation of CV is that it does not distinguish between physiological fluctuations (like heartbeat or breathing) and motion artifacts. This might lead to false rejection of strong signals or acceptance of flat / poor flat signals due to low variability. Therefore, careful and individual threshold tuning is required. We further recommend to additionally perform a visual check of the data segment to identify potential flat signals and avoid false negatives.
Scalp Coupling Index (SCI)
The Scalp Coupling Index (SCI) is designed to assess optode-scalp contact based on the presence of cardiac oscillations in the raw signal [2]. It calculates the correlation between the two wavelengths (typically 760 and 850 nm).
PRO: The idea is simple: physiological signals affect both wavelengths similarly, while random noise or poor contact does not. Therefore, strong correlation indicates good signal quality, while weak correlation indicates bad signal quality.
CON: The main limitation of SCI is that noise that affects both wavelengths equally, such as motion artifacts, can still result in high correlation and therefore escape detection. In literature, a SCI threshold values of +0.75 or +0.80 were used for classification of good channel and channel inclusion. [2, 3].
Placing Headgear Optodes Efficiently Before Experimentation (PHOEBE)
The PHOEBE (Placing Headgear Optodes Efficiently Before Experimentation) addresses SCI's limitations by combining it with spectral analysis [4]. It looks at the spectral power of the cross-correlation between wavelengths, focusing specifically on the strength of the cardiac peak. Good quality signals tend to have a clear, dominant peak at the cardiac frequency, while signals with motion artefacts exhibit a broader, less defined spectrum with lower peak power.
PRO: By isolating the heartbeat component, PHOEBE improves sensitivity to poor-quality channels, even in the presence of motion.
Signal Quality Index (SQI)
As a nuanced and robust method for assessing fNIRS signal quality, we developed the Signal Quality Index (SQI) [5]. Unlike earlier approaches that classify channels into just ‘good’ or ‘bad’, the SQI provides a numeric scale from 1 to 5, allowing for more flexible and informative assessments.
PRO: The algorithm focuses on detecting the cardiac component in the signal, which is a strong indicator of good optode-scalp coupling. It does so by combining processing steps with three consecutive rating stages: 1) identifying very low-quality signals, 2) identifying very high-quality signals and 3) signal quality rating. Combining these steps into a sophisticated algorithm ensures higher performance of the SQI algorithm compared to SCI and PHOEBE [5]. More information can be found in this paper.
Figure 2: The SQI as displayed in OxySoft
This blogpost gives a quick overview of algorithms that can be used to automatically assess signal quality. If you want to know more about how to handle low-quality channels, please have a look at our blogpost on Assessing NIRS signal quality – Implementation of the Signal Quality Index (SQI) or contact us at askforinfo@artinis.com.
Literature
[1] Christoph H. Schmitz, David P. Klemer, Rosemarie Hardin, Michael S. Katz, Yaling Pei, Harry L. Graber, Mikhail B. Levin, Rita D. Levina, Nelson A. Franco, William B. Solomon, and Randall L. Barbour. Design and implementation of dynamic near-infrared optical tomographic imaging instrumentation for simultaneous dual-breast measurements. Appl. Opt. 44, 2140-2153 (2005)
[2] Pollonini L, Olds C, Abaya H, Bortfeld H, Beauchamp MS, Oghalai JS. Auditory cortex activation to natural speech and simulated cochlear implant speech measured with functional near-infrared spectroscopy. Hear Res. 2014 Mar;309:84-93. doi: 10.1016/j.heares.2013.11.007. Epub 2013 Dec 14. PMID: 24342740; PMCID: PMC3939048.
[3] Klein F. Optimizing spatial specificity and signal quality in fNIRS: an overview of potential challenges and possible options for improving the reliability of real-time applications. Front Neuroergon. 2024 Jun 5;5:1286586. doi: 10.3389/fnrgo.2024.1286586. PMID: 38903906; PMCID: PMC11188482.
[4] Pollonini L, Bortfeld H, Oghalai JS. PHOEBE: a method for real time mapping of optodes-scalp coupling in functional near-infrared spectroscopy. Biomed Opt Express. 2016 Nov 15;7(12):5104-5119. doi: 10.1364/BOE.7.005104. PMID: 28018728; PMCID: PMC5175555.
[5] Sappia MS, Hakimi N, Colier WNJM, Horschig JM. Signal quality index: an algorithm for quantitative assessment of functional near infrared spectroscopy signal quality. Biomed Opt Express. 2020 Oct 27;11(11):6732-6754. doi: 10.1364/BOE.409317. PMID: 33282521; PMCID: PMC7687963.