In Artinis NIRS blog, you will find the latest trends in (f)NIRS, NIRS studies and applications, tutor from the leaders of near infrared spectroscopy, not to mention detailed insights and tips and tricks for your research!
Search blog post topic
fNIRS analysis toolbox series – MNE/Python
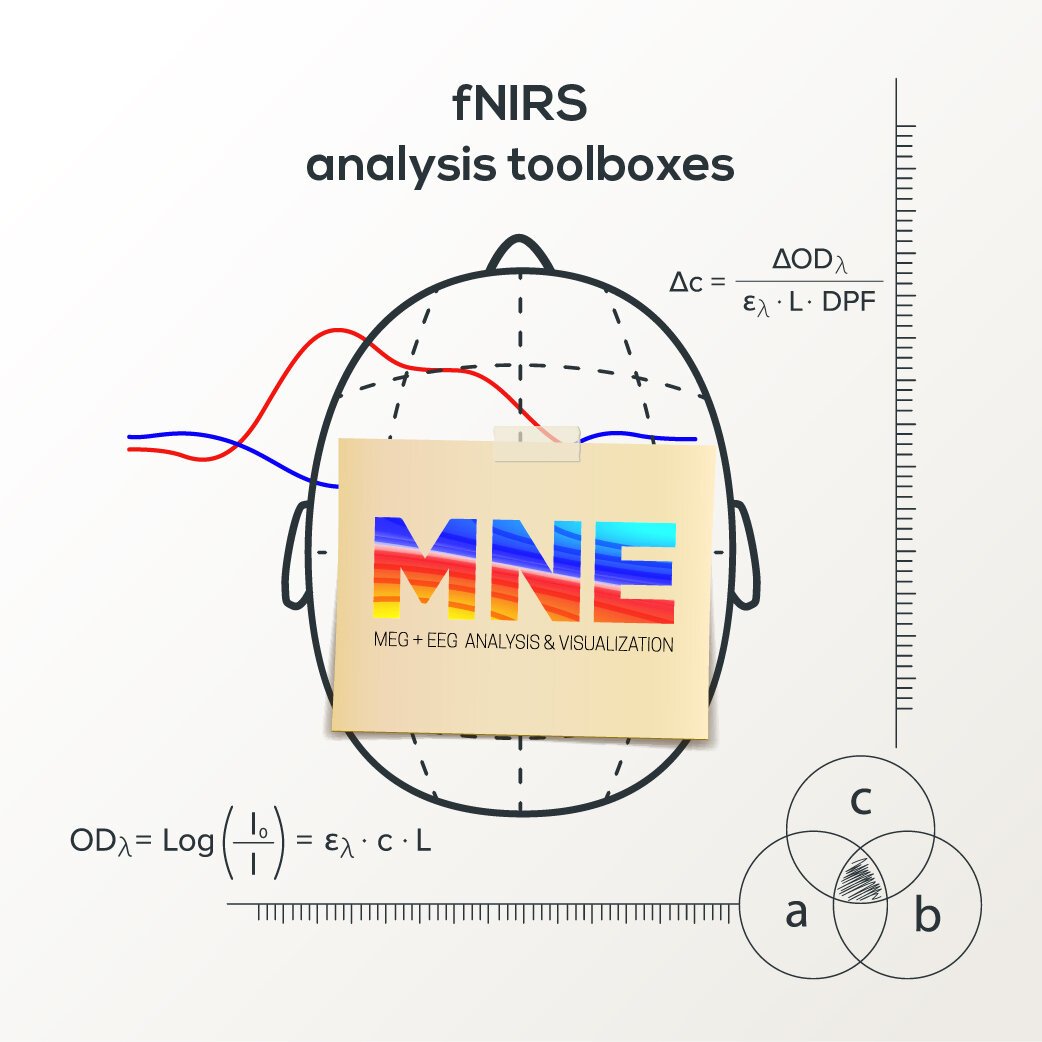
In this blog post, we present MNE-NIRS, a Python toolbox for analyzing NIRS/fNIRS data, which aims at researchers with a background in engineering, neuroscience and/or AI. The toolbox is handled by scripting the processing pipeline, which can be done in a regular Python script or within a Jupyter notebook.
fNIRS analysis toolbox series – Homer
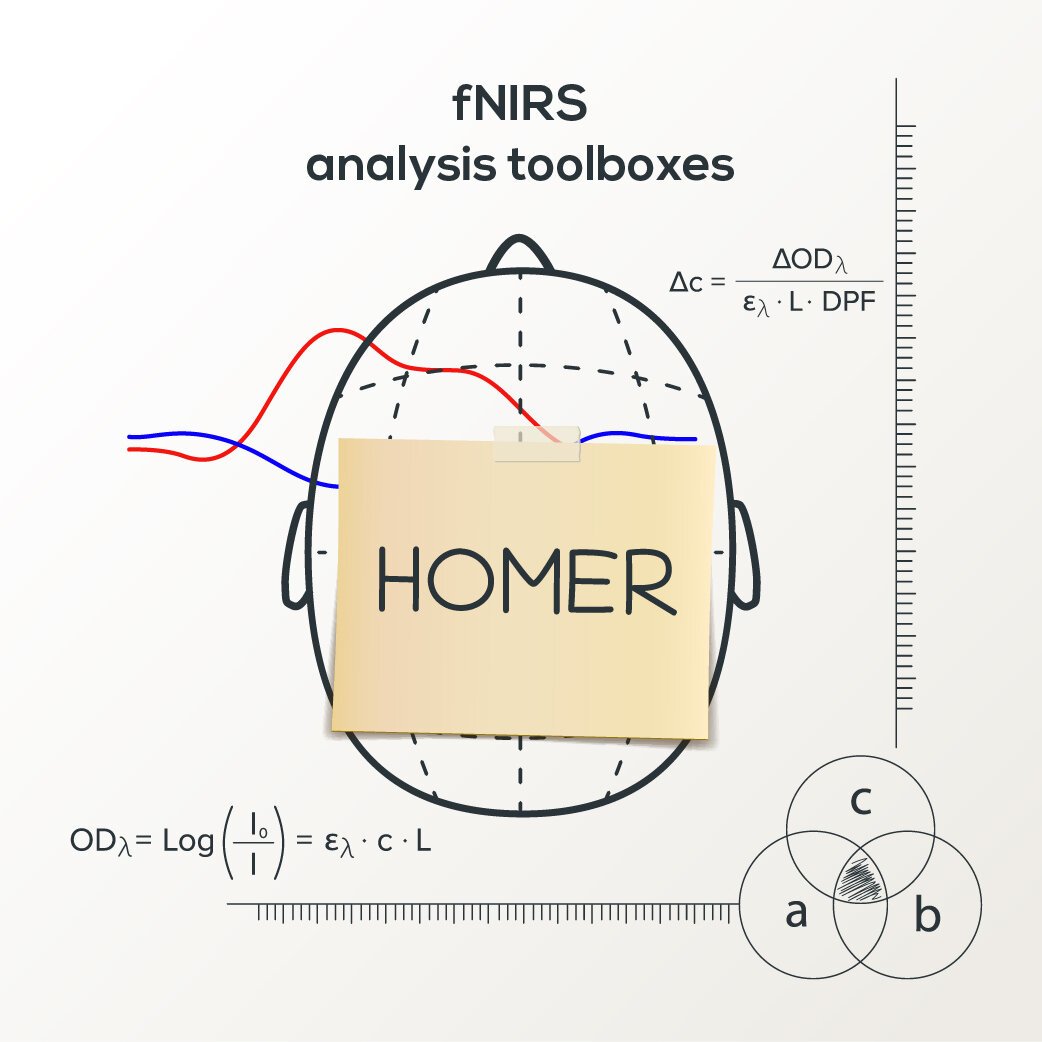
Here we present Homer3, an open-source MATLAB toolbox for analysis of fNIRS data and for creating maps of brain activation. In this blog post, we present the basic principle of Homer3 and show a simple example of how to read in data, preprocess the data (filtering only), average over trials as well as over subjects, and plot the final result in a graph.
fNIRS analysis toolbox series – Brain AnalyzIR
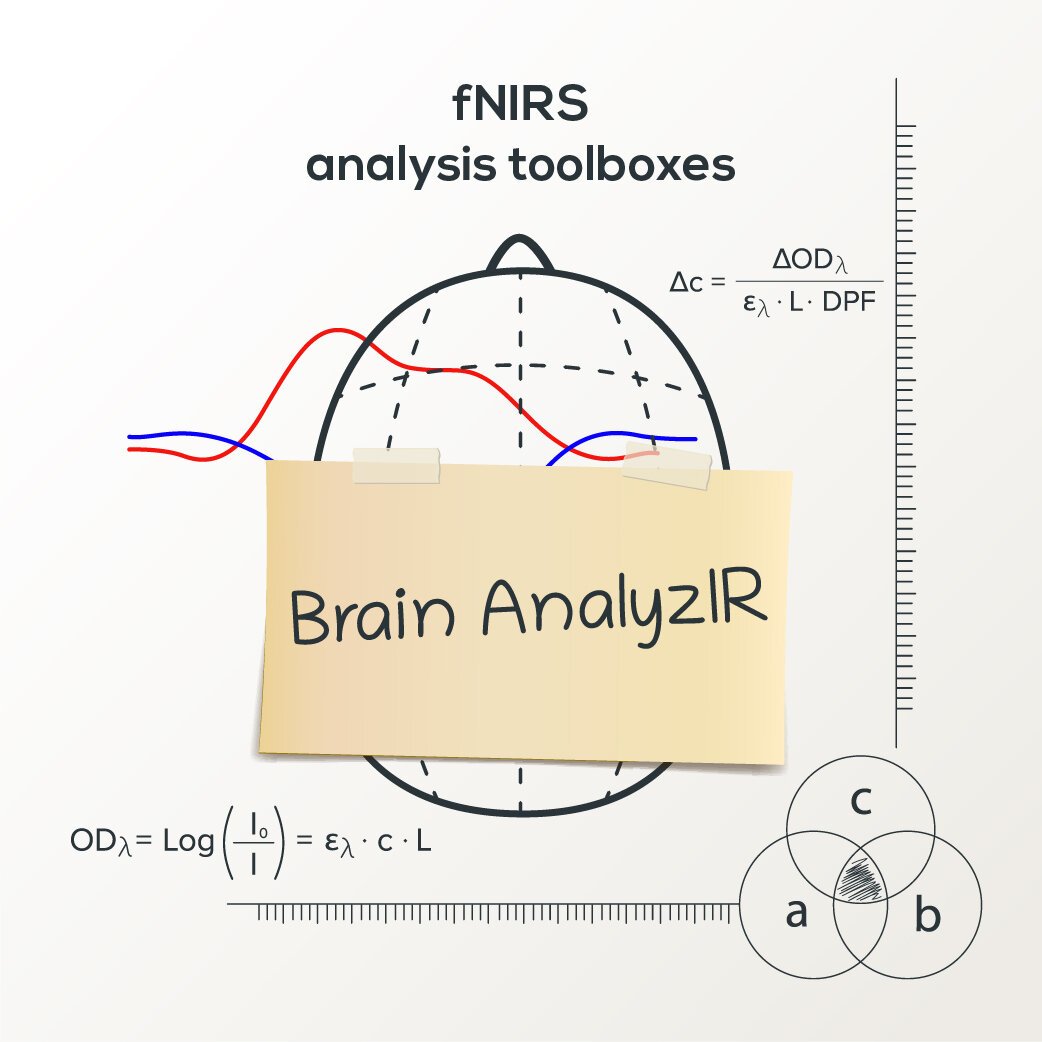
Here we present the NIRS Brain AnalyzIR toolbox, a toolbox for analysis of (f)NIRS data in Matlab. NIRS Brain AnalyzIR toolbox aims at researchers with a background in neuroscience. The toolbox is suitable for researchers having basic knowledge of Matlab and especially those who are comfortable with object-oriented programming.