
Heart rate extraction from NIRS signal
A commonly asked question is “What are the advantages of near-infrared spectroscopy (NIRS) over electroencephalography (EEG)?”
NIRS signals are, in general, less susceptible to artifacts like motion artifacts or electrical noises. There are, however, also physiological components such as heartbeat, breathing, and Mayer-waves present in the signal. Although not an artifact, these components are usually filtered out since they are not useful in determining the pure hemodynamic response signal of the brain. However, there is interesting information in, e.g., the heartbeat as well. In this blog, we want to talk about taking advantage of the heartbeat in the NIRS signals and extracting the heart rate signal from them.
Heart rate variability (HRV) is a measure of the variations in the time intervals between the heartbeats, which is controlled by the autonomous nervous system. The heart rate (HR) is defined as the number of heartbeats in a minute, often called BPM (beats per minute). The gold standard of HR tracking is to analyze the inter-beat intervals (IBIs) using an electrocardiogram. Alternatively, the HR signal can be measured based on blood flow pulsation derived from the NIRS signals. Heartbeats are the most visible physiological component in the NIRS signals. It is observed by the pulsatile fluctuations of around 1 s in the time domain of the raw NIRS signals, both in optical density (OD) signals as well as concentration changes in oxygenated (O2Hb) and deoxygenated (HHb) hemoglobin (See Figures 1(A) and 1(B)). Heartbeat as a quasi-periodic component can also be seen in the frequency domain of the signals as a strong component around 1Hz (See Figure 1(C)). The signals used here were recorded using an OxyMon device with a sampling rate of 50 Hz from a healthy adult participant during resting state.
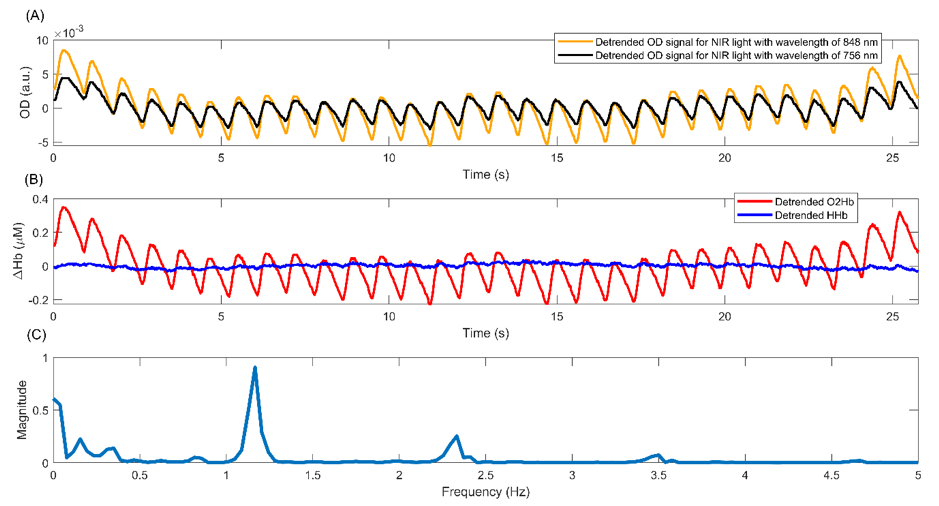
Figure 1. A sample of NIRS signal recorded using OxyMon device with a sampling rate of 50 Hz. The heartbeat artifact is visibly seen in both the time domain of the raw NIRS signals: OD (A) and O2Hb and HHb (B) signals, as well as frequency domain: the magnitude of the Fourier transform (C). The raw NIRS signals have been detrended in (A) and (B), and the spectrum shown is for the OD obtained for the NIR light with a wavelength of 848 nm.
Two different algorithms are explained in this blog for the extraction of HR from NIRS signals:
HR extraction using autocorrelation
HR extraction using peak detection
These two algorithms can be applied to a raw NIRS signal having a clear heartbeat, so either on OD or O2Hb signals. These algorithms include a preprocessing step before doing the HR extraction process to enhance the performance of the algorithm during the extraction process. In this step, the raw NIRS signal is filtered using a band-pass filter in order to eliminate both high- and low-frequency components which are irrelevant to the heartbeat component.
HR extraction using autocorrelation
After the preprocessing, the filtered raw NIRS signal (either the OD or O2Hb signal) is windowed with T seconds windows overlapping T0 seconds (). Then, the autocorrelation signal for the windowed signal is obtained. If the quality and sampling speed of the raw NIRS signal is good enough (greater than 10 Hz), it has a pulsatile heartbeat component in the signal. The autocorrelation of this pulsatile signal peaks in the delay at which the signal is most identical, which represents the overlapping peaks of two subsequent heartbeats.
Figure 2 shows one windowed raw NIRS signal with T=3s windows overlapping T0=2s (Figure 2(A)) together with its autocorrelation signal (Figure 2(B)). It shows both signals have clear heartbeats with a time interval lower than 1s. The lag of the second local maximum in the autocorrelation signal is determined (red dashed line) in order to obtain the HR. Then its inverted value is multiplied by 60 to obtain HR in BPM.
Using this algorithm, the HR can either be computed and updated every T seconds without overlapping the consecutive windows, or even be computed every T0 seconds using an overlapping window strategy (T0<T). Note that the window size T should be chosen so that the window contains at least two heartbeats.
Figure 2. A sample of the filtered OD signal (A) with its autocorrelation signal (B). The OD signal is for the NIR light with a wavelength of 848 nm, which has been windowed with T=3s windows overlapping T0=2s. The red dashed line shows the lag when the second local maximum is happened in the autocorrelation signal, showing the delay at which the signal is the most identical, which represents the overlapping peaks of two subsequent heartbeats.
HR extraction using peak detection
In the previous algorithm, the most prominent HR in the T seconds window is considered as the HR within this time interval. This algorithm is not useful when the variation of the HR within the T seconds windows is important. In this case, by detecting each heartbeat and then calculating its time interval with the previously detected heartbeat, we can compute and update the HR with every occurring heartbeat in the NIRS signal. For detecting the heartbeats, we can use a peak detection algorithm.
There are different methods for real-time detecting the peaks in period or quasi-period signals. Multiple real-time peak detection methods for HR extraction have been compared in literature in both simulated and in vivo NIRS signals, reporting that AMPD (automatic multiscale-based peak detection) is a robust method for this purpose (Hakimi & Setarehdan, 2018).
AMPD is an automatic peak detection method in the noisy periodic and quasi-periodic signals (Scholkmann et al., 2012). This method is based on the calculation and analysis of the local maxima scalogram, which produces a matrix comprising the scale-dependent occurrences of the local maxima. For Matlab users, there is also the function doing the peak detection, which is named findpeaks, where you need to adjust different thresholds if you desire a proper performance.
Figure 3(A) shows a sample of a raw NIRS signal together with the peaks of the heartbeats detected by means of the AMPD method (red stars). This method only works on clean(ed) data, so data in which a clear heartbeat is distinguishable, either due to a high signal-to-noise ratio or after filtering.
Figure3(B) shows the HR signal extracted using the autocorrelation (blue curve) and peak detection algorithms (red curve). The autocorrelation algorithm was applied using T=3s windows overlapping 2s. In this example, the peak detection algorithm is useful when small changes of the HR are important. In contrast, the autocorrelation algorithm is more robust and gives a better result when high-frequency component is present in the data.
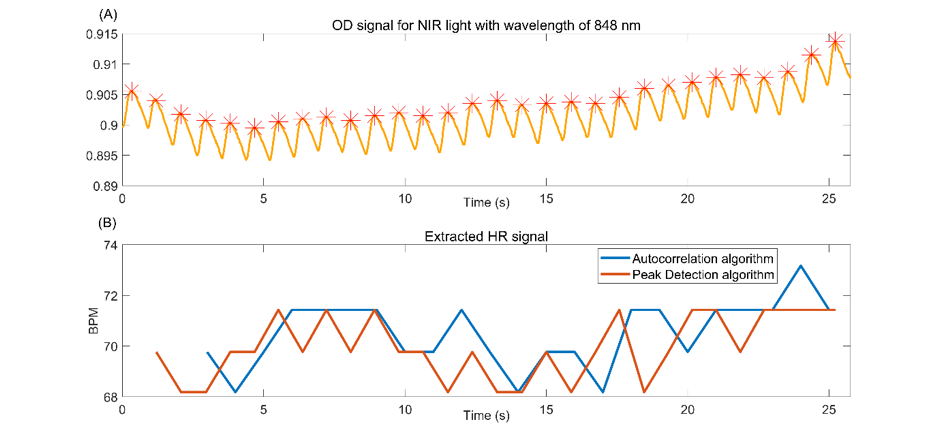
Figure 3. A sample of an OD signal (A) with the HR signal extracted from it (B). The red stars in (A) indicate the heartbeat peaks in the OD signal for the NIR light with a wavelength of 848 nm, which have been detected using the AMPD method. The blue and red curves in (B) show the extracted HR signal using autocorrelation and peak detection algorithms, respectively.
Conclusion
One of the advantages of NIRS compared with EEG is the physiological information that exists in the raw NIRS signals. Heartbeat is the most visible physiological information in the NIRS signal that provides the opportunity to derive the HR signal. Here, we explained two different algorithms for the extraction of HR from NIRS signals, the autocorrelation and peak detection algorithms. The peak detection algorithm is more favorable when small changes in HR are important. Otherwise, the autocorrelation algorithm is more robust if artifacts with the high-frequency component are present in the signal.
About the author

Naser Hakimi received his B.Sc. and M.Sc. degrees in Electrical and Biomedical Engineering from Shahid Beheshti University (Tehran, Iran) in 2015 and University of Tehran (Tehran, Iran) in 2018. His main research during his M.Sc. was the extraction of heart rate signal from near-infared spectroscopy (NIRS) and investigating its feasibility in stress assessment.
References
Hakimi, N., & Setarehdan, S. K. S. K. (2018). Stress assessment by means of heart rate derived from functional near-infrared spectroscopy. Journal of Biomedical Optics, 23(11), 1.
Scholkmann, F., Boss, J., & Wolf, M. (2012). An Efficient Algorithm for Automatic Peak Detection in Noisy Periodic and Quasi-Periodic Signals. Algorithms, 5(4), 588–603.


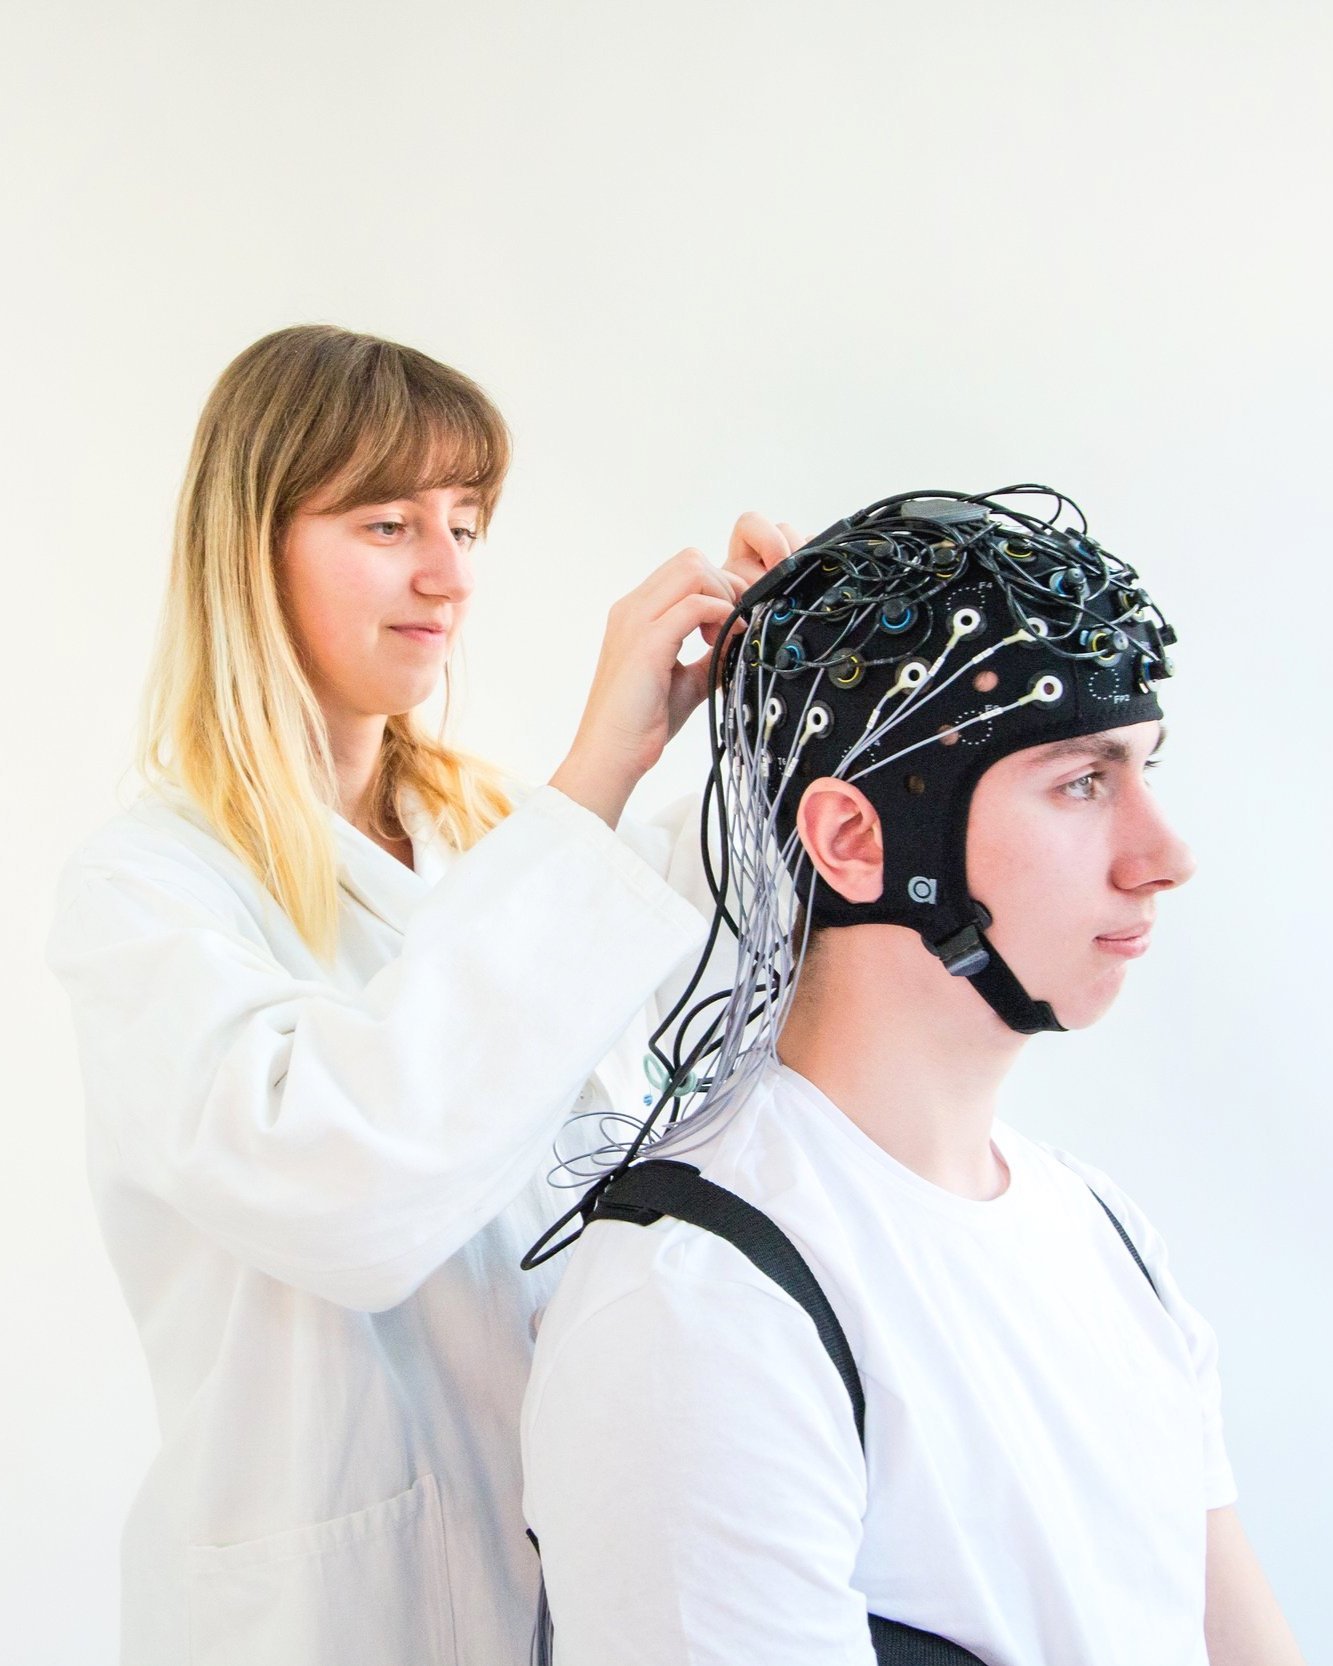


When simultaneously measuring fNIRS and EEG, placement of both devices should ideally ensure proper coverage of the desired measurement location, minimize interference and take into account (technical) characteristics and basic of both techniques. Read this blog post to learn more about relevance of these points and further recommendations for integrating fNIRS and EEG on one head.