
In Artinis NIRS blog, you will find the latest trends in (f)NIRS, NIRS studies and applications, tutor from the leaders of near infrared spectroscopy, not to mention detailed insights and tips and tricks for your research!
Search blog post topic
fNIRS analysis toolbox series – MNE/Python
In this blog post, we present MNE-NIRS, a Python toolbox for analyzing NIRS/fNIRS data, which aims at researchers with a background in engineering, neuroscience and/or AI. The toolbox is handled by scripting the processing pipeline, which can be done in a regular Python script or within a Jupyter notebook.
fNIRS analysis toolbox series – Homer
Here we present Homer3, an open-source MATLAB toolbox for analysis of fNIRS data and for creating maps of brain activation. In this blog post, we present the basic principle of Homer3 and show a simple example of how to read in data, preprocess the data (filtering only), average over trials as well as over subjects, and plot the final result in a graph.
fNIRS analysis toolbox series – FieldTrip
Here we present FieldTrip, which is a MATLAB analysis toolbox that was originally designed for electrophysiological data analysis. However, FieldTrip supports fNIRS data analysis as well. It contains high-level functions that can be combined in a MATLAB script. It aims at researchers with a background in neuroscience, engineering, optics and physics.
fNIRS analysis toolbox series – Brain AnalyzIR
Here we present the NIRS Brain AnalyzIR toolbox, a toolbox for analysis of (f)NIRS data in Matlab. NIRS Brain AnalyzIR toolbox aims at researchers with a background in neuroscience. The toolbox is suitable for researchers having basic knowledge of Matlab and especially those who are comfortable with object-oriented programming.
fNIRS analysis toolbox series – NIRSTORM
Here we present NIRSTORM, a NIRS analysis plugin for the MATLAB-based MEEG Brainstorm toolbox. It is aimed at researchers with a background in neuroscience, engineering, optics and physics. Here, we present the basic principle of NIRSTORM and show a simple example of how to go from raw data to a visualisation of the average response over trials and sessions.
fNIRS analysis toolbox series – OxySoft
OxySoft is our proprietary, and dedicated, NIRS software used to collect, store, view, and analyze all necessary data. Here, we present the basic principle of data analysis within OxySoft itself and show a simple example of how to read in data, preprocess the data (filtering only), average over trials and over subjects and plot the final result in a graph. Finally, we will show how to get the data into a format suited for statistical analysis.
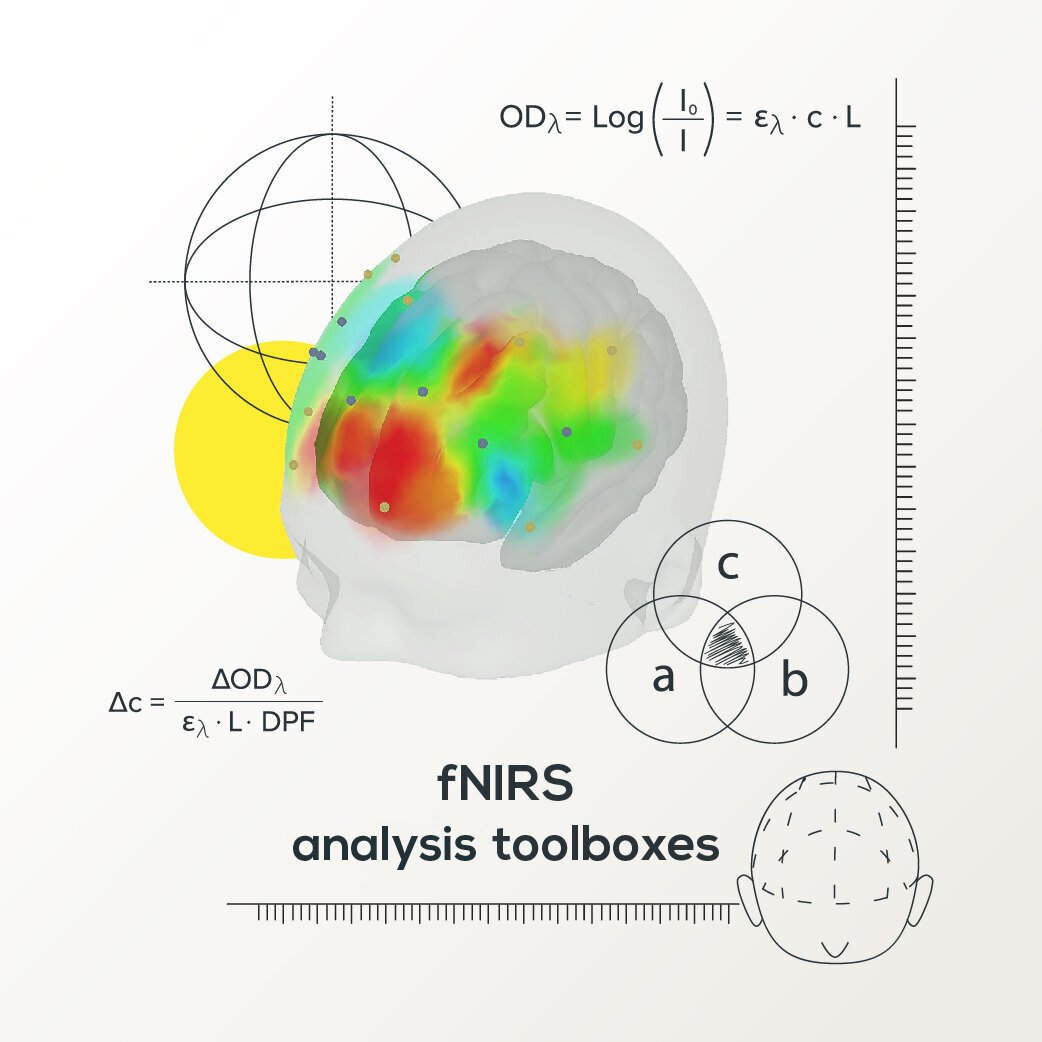
fNIRS analysis toolbox series – Introduction
In the coming months, we will highlight several toolboxes that are used by fNIRS researchers. A list of available toolboxes is compiled by the society for functional Near Infrared Spectroscopy. There are many toolboxes, each with its own strengths and specializations.

Publication overview 2016
At Artinis we consider ultimate success to be good publications by our customers. To see how we are doing we have systematically searched Google Scholar for NIRS and fNIRS publications.