In Artinis NIRS blog, you will find the latest trends in (f)NIRS, NIRS studies and applications, tutor from the leaders of near infrared spectroscopy, not to mention detailed insights and tips and tricks for your research!
Search blog post topic
fNIRS analysis toolbox series – Homer
Here we present Homer3, an open-source MATLAB toolbox for analysis of fNIRS data and for creating maps of brain activation. In this blog post, we present the basic principle of Homer3 and show a simple example of how to read in data, preprocess the data (filtering only), average over trials as well as over subjects, and plot the final result in a graph.
fNIRS analysis toolbox series – FieldTrip
Here we present FieldTrip, which is a MATLAB analysis toolbox that was originally designed for electrophysiological data analysis. However, FieldTrip supports fNIRS data analysis as well. It contains high-level functions that can be combined in a MATLAB script. It aims at researchers with a background in neuroscience, engineering, optics and physics.
fNIRS analysis toolbox series – Brain AnalyzIR
Here we present the NIRS Brain AnalyzIR toolbox, a toolbox for analysis of (f)NIRS data in Matlab. NIRS Brain AnalyzIR toolbox aims at researchers with a background in neuroscience. The toolbox is suitable for researchers having basic knowledge of Matlab and especially those who are comfortable with object-oriented programming.
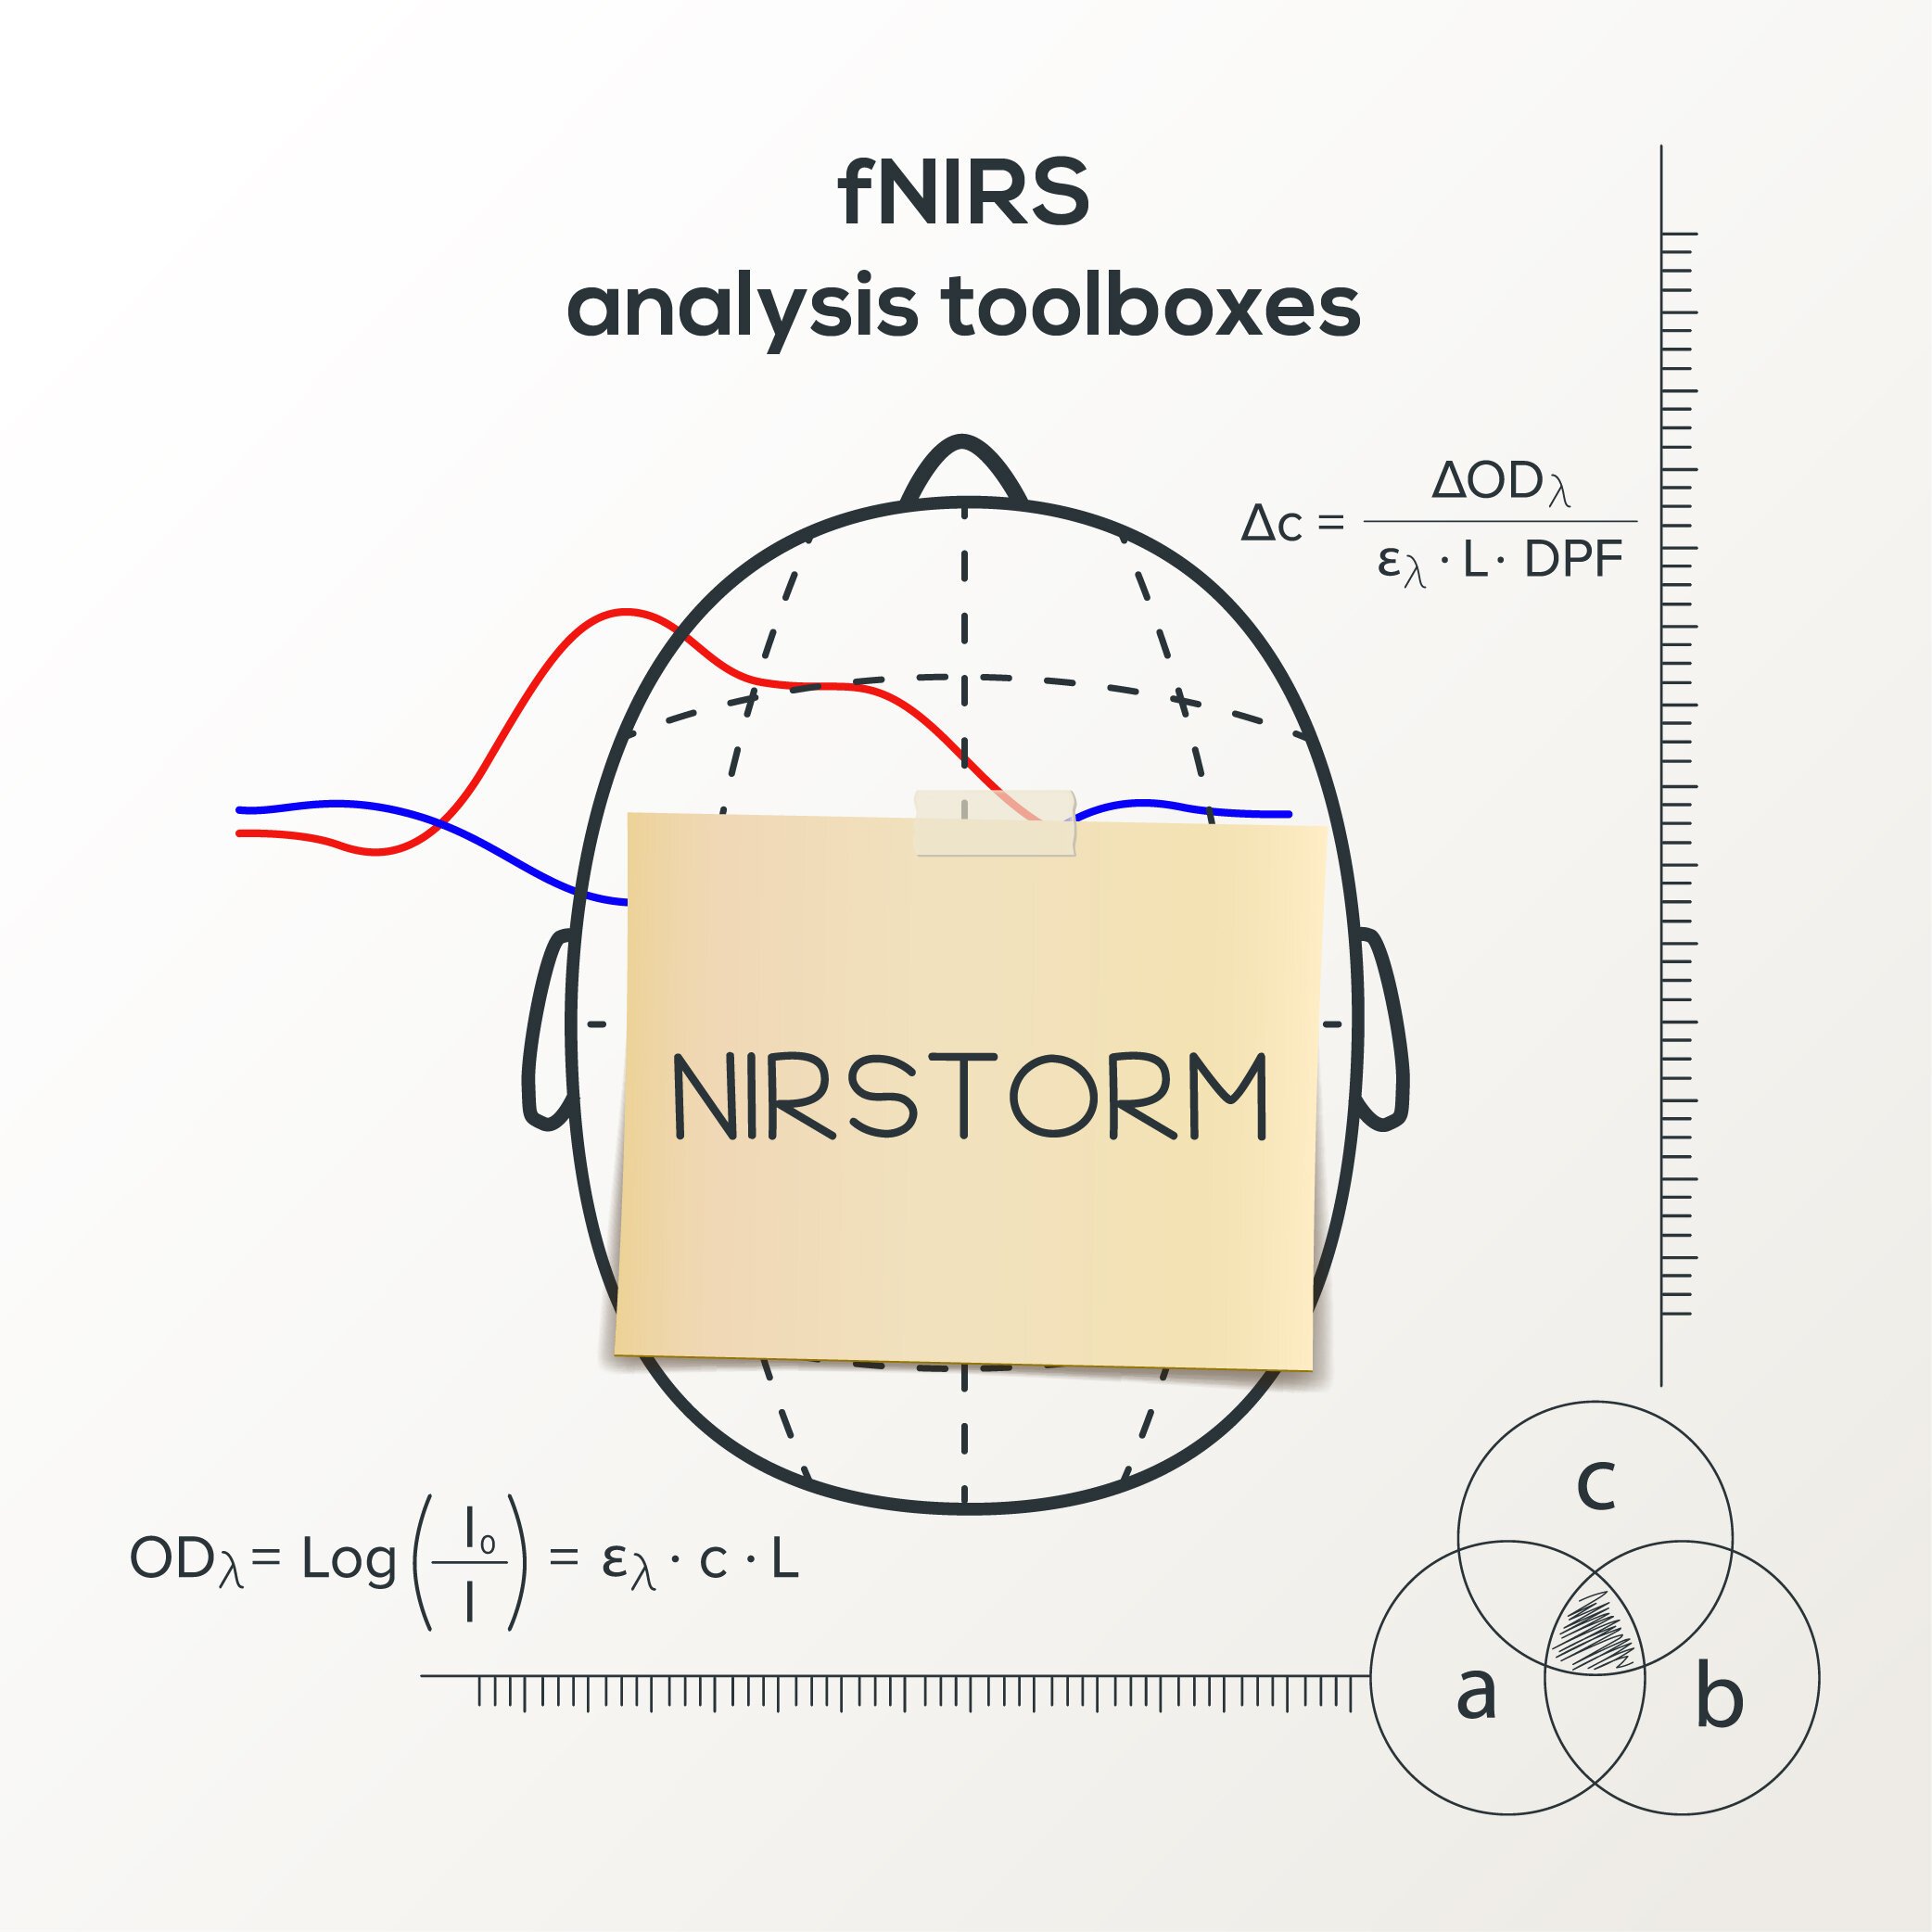
fNIRS analysis toolbox series – NIRSTORM
Here we present NIRSTORM, a NIRS analysis plugin for the MATLAB-based MEEG Brainstorm toolbox. It is aimed at researchers with a background in neuroscience, engineering, optics and physics. Here, we present the basic principle of NIRSTORM and show a simple example of how to go from raw data to a visualisation of the average response over trials and sessions.
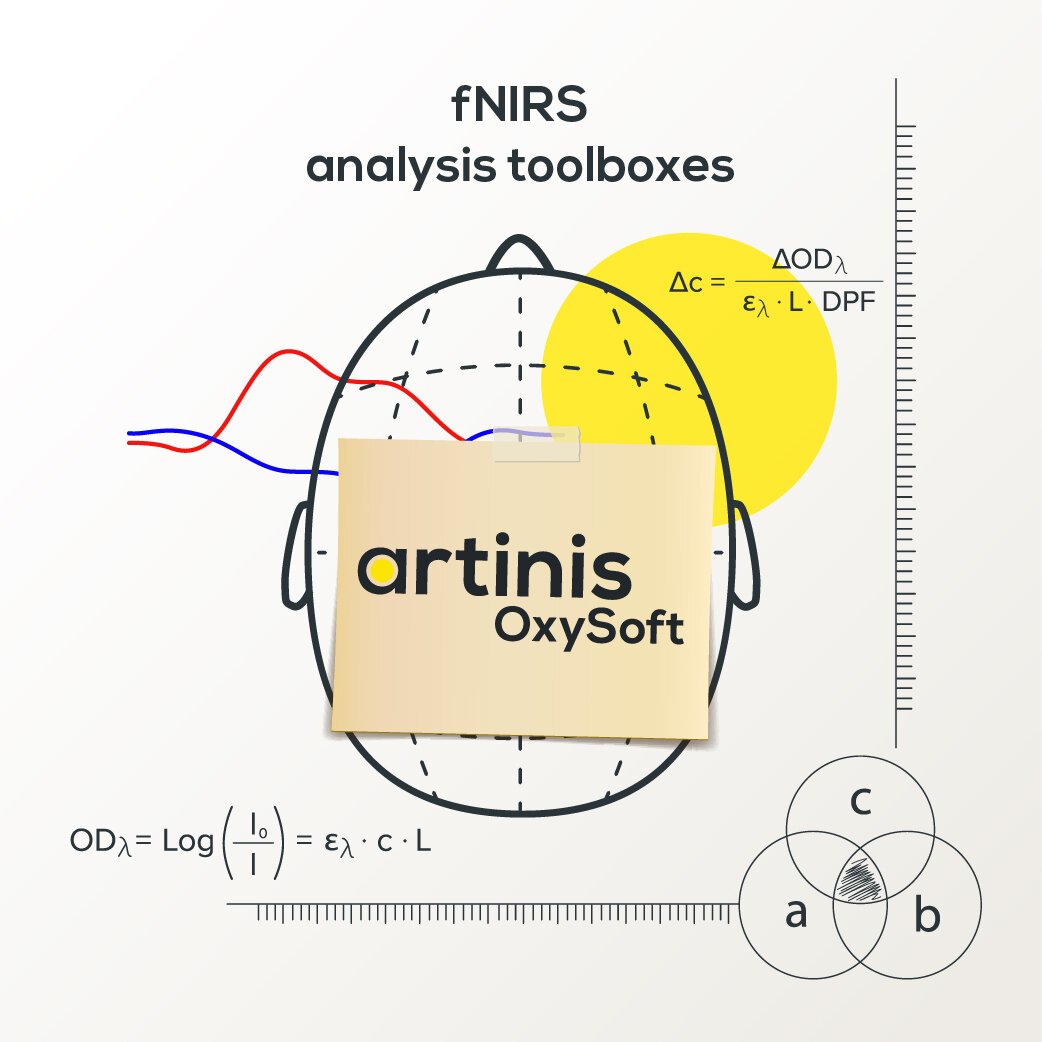
fNIRS analysis toolbox series – OxySoft
OxySoft is our proprietary, and dedicated, NIRS software used to collect, store, view, and analyze all necessary data. Here, we present the basic principle of data analysis within OxySoft itself and show a simple example of how to read in data, preprocess the data (filtering only), average over trials and over subjects and plot the final result in a graph. Finally, we will show how to get the data into a format suited for statistical analysis.
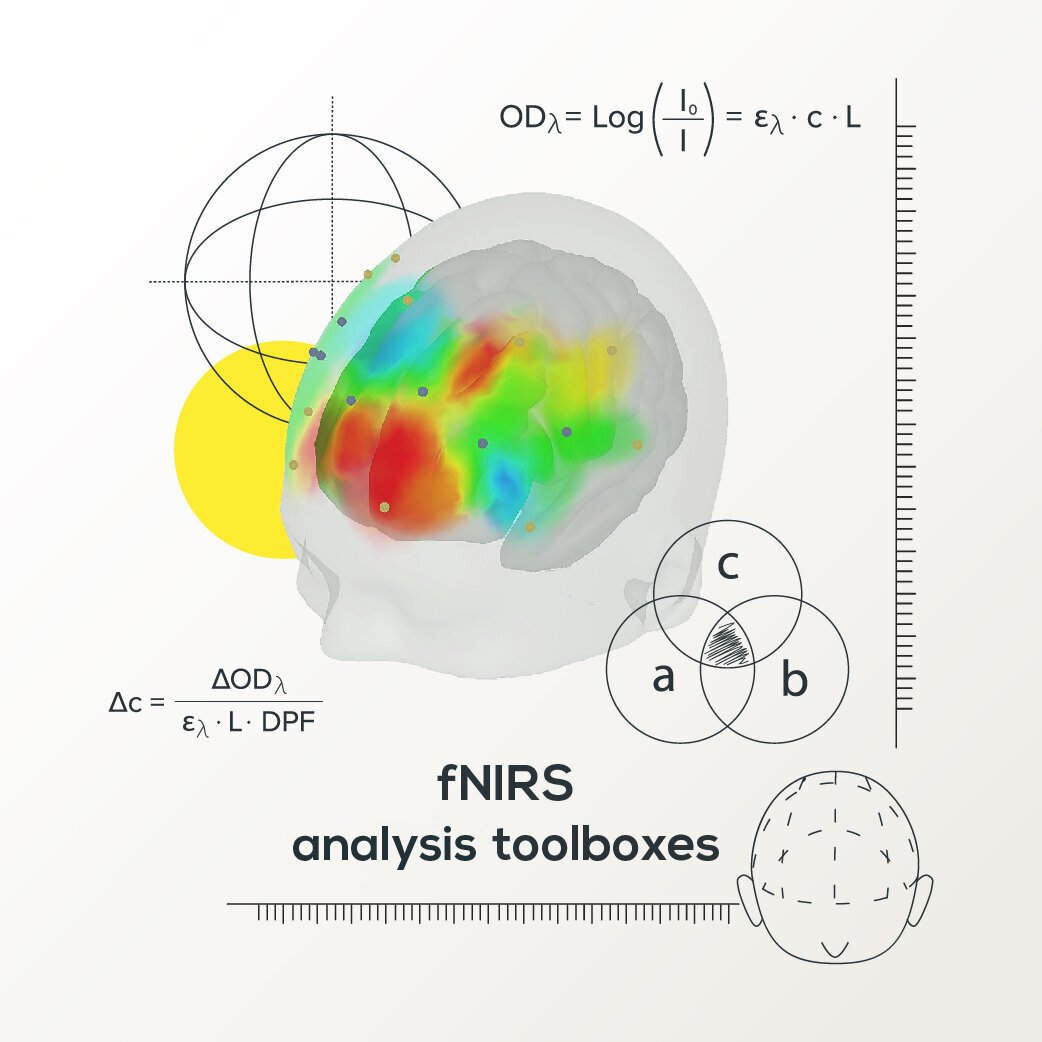
fNIRS analysis toolbox series – Introduction
In the coming months, we will highlight several toolboxes that are used by fNIRS researchers. A list of available toolboxes is compiled by the society for functional Near Infrared Spectroscopy. There are many toolboxes, each with its own strengths and specializations.
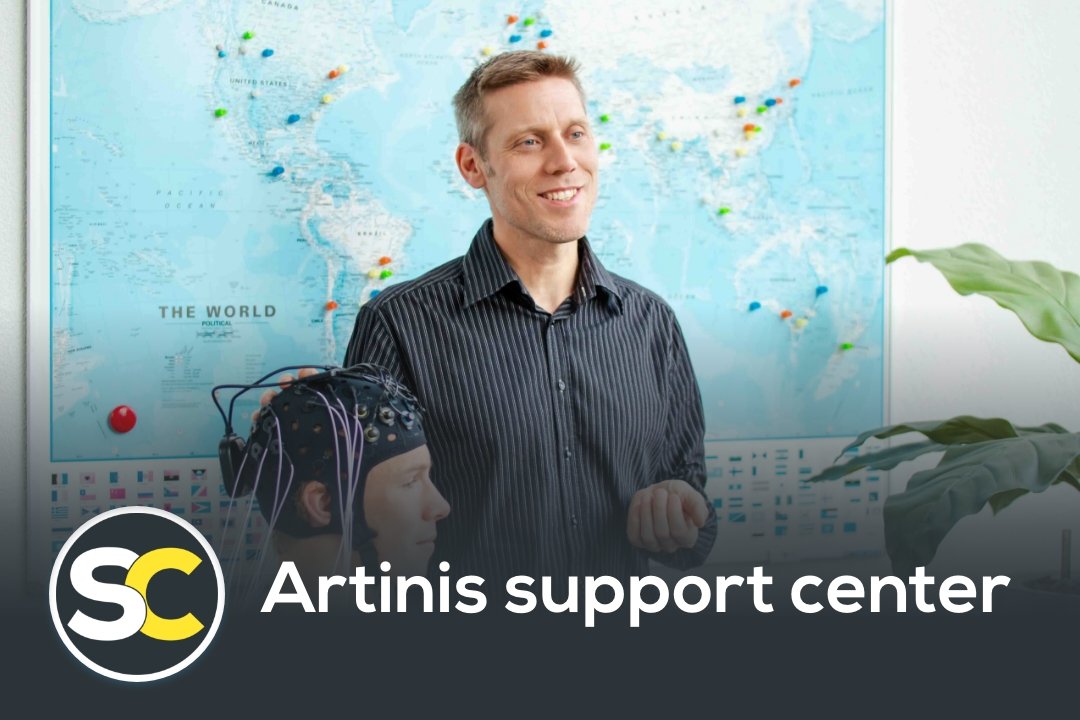
The Elevated Artinis Support Center – Receiving easy and quick support and knowledge
Providing superior support solutions to our customers is one of our highest priorities. We are happy to announce that we recently released our elevated support center, which aims to provide support and education quickly and easily to all Artinis users.
Read this blogpost about the content and aims of the different pages of the support center.
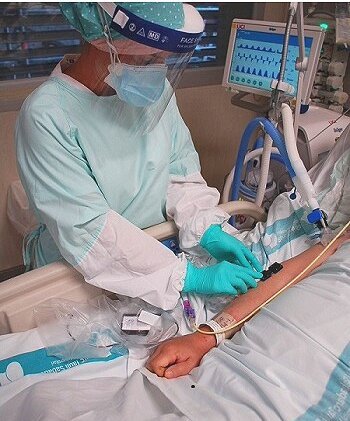
Non-invasive evaluation of the endothelial and microvascular dysfunction induced by COVID-19
To provide professional intensive care specifically fit to cure COVID-19, hospitals need the appropriate space and equipment. Health care professionals have been working with limited resources in extreme environments but knowledge and experience is rapidly expanding. Several institutes have been implementing NIRS to study the endothelial and microvascular dysfunction to support the development of targeted and individualized therapies.
How to: Start a measurement and do a short analysis
If you don’t have time to read our extensive manuals, but would still like some quick pointers on how to start a measurement with one of our state of the art fNIRS devices… you’re in the right place! In this blog we will get you set-up in no time and discuss some of the analysis options our proprietary software, OxySoft, offers.

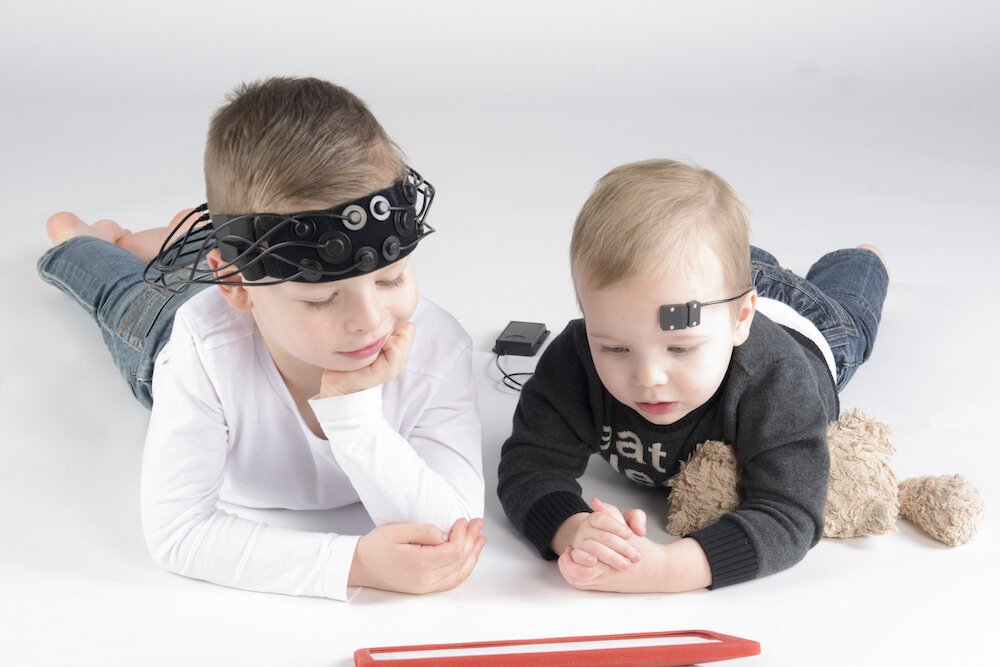
Brite MKII: Wearable, Highly-Flexible, Optimized, Accurate NIRS!
Meet the latest Artinis wearable NIRS system, designed for brain imaging in a wide range of settings and populations. Optical imaging was never so easy!
Heart rate extraction from NIRS signal
A commonly asked question is “What are the advantages of NIRS over EEG?”. NIRS signals are, in general, less susceptible to artifacts like motion artifacts or electrical noises. There are, however, also physiological components such as heartbeat, breathing, and Mayer-waves present in the signal. Although not an artifact, these components are usually filtered out since they are not useful in determining the pure hemodynamic response signal of the brain. Nevertheless, there is interesting information in the heartbeat. In this blog, we talk about taking advantage of the heartbeat in the NIRS signals and extracting the heart rate signal from them.
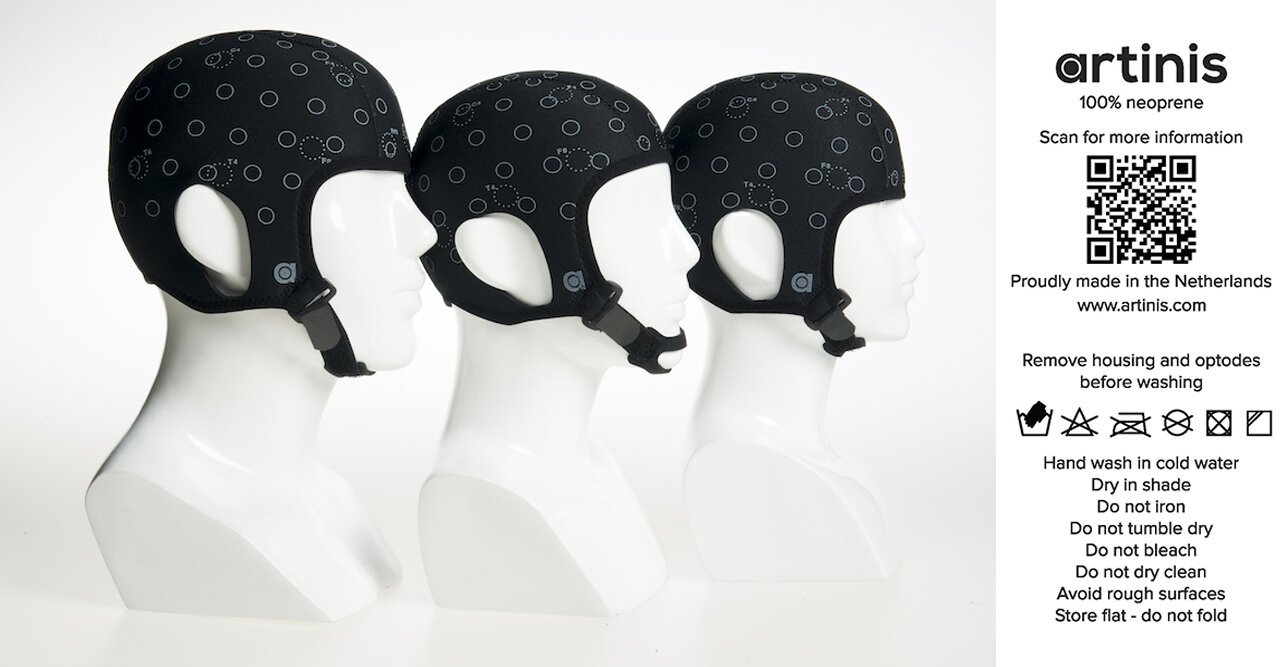
How to clean your Artinis NIRS systems and accessories?
COVID-19 has had a major impact on all of us. For a while, Universities were closed and research was put on hold. Now slowly but surely, we are going back to the labs and starting our experiments again. NIRS experiments include contact with patients and research participants, we therefore find it important to inform you about how to clean the Artinis NIRS devices.